Determination of sound absorption in the impedance tube.
Acoustics, component properties, reliability
Good knowledge of the parameters influencing material modeling is required when designing acoustic component properties. Fraunhofer LBF is researching new methods for reliably determining the individual influencing parameters in the future.
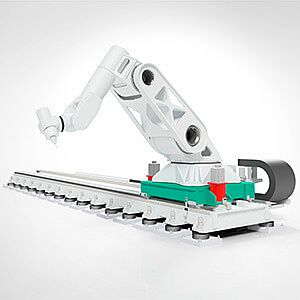
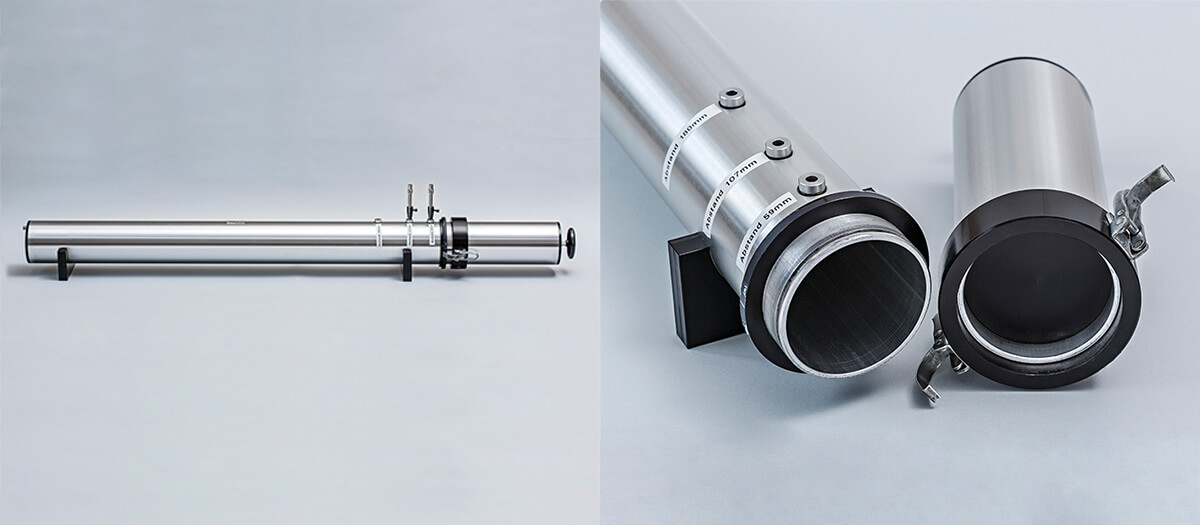
An impedance tube (Fig. 1) provides the opportunity to determine the sound absorption coefficient of foams quickly and cost-effectively.
The sound absorption coefficient in an impedance tube can only be determined with vertical sound incidence, which hardly ever occurs in actual use. However, acoustic material characterization using small material specimens compared to measurements in the echo chamber has an enormous advantage in terms of cost.
The transfer-function method according to DIN EN ISO 10534-2 offers the possibility of determining the frequency-dependent absorption coefficient quickly with only one measurement. When installing the sound-absorbing material in the impedance tube, various installation options are available that should all lead, in theory, to the same measurement results. However, the diameter of the specimen, the way the specimen is installed, the method of cutting the specimen and therefore also the experience of the person cutting the specimen, will affect the result of the absorption coefficient determined.
The foam material used for these investigations is supplied as sheet material. Instructions on how to produce/cut test specimens are missing from the standard. The finished circular specimens are then inserted into the specimen holder of the impedance tube and can be measured. Three test specimens were produced in each case, one of each with a slight oversize and undersize respectively. This enables a statistical evaluation of the tests.
These parameters were investigated according to a full factorial design. The absorption coefficient is dependent on the frequency. On installing the material specimens in the impedance tube, DIN 10534-2 states: “The specimen is inserted into the tube” and “The test specimen must fit well in the sample holder. However, it must not be compressed excessively or arch upwards.” It also states: “At least two test specimens, or, in the case of non-uniform test specimens, several, should be tested for repeat measurements under the same installation conditions.”
Existing round robin tests of foam materials in impedance tubes mix all the effects already mentioned above. For the investigation here, a different way was chosen deliberately: all the measurements were carried out by one person on one measurement system.
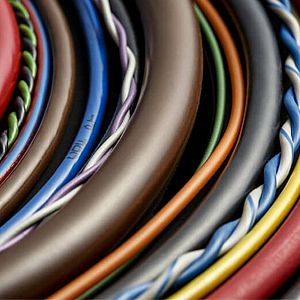
For example, different cutting methods were compared with each other. Significant differences can already be seen at the cut face (Fig. 2).
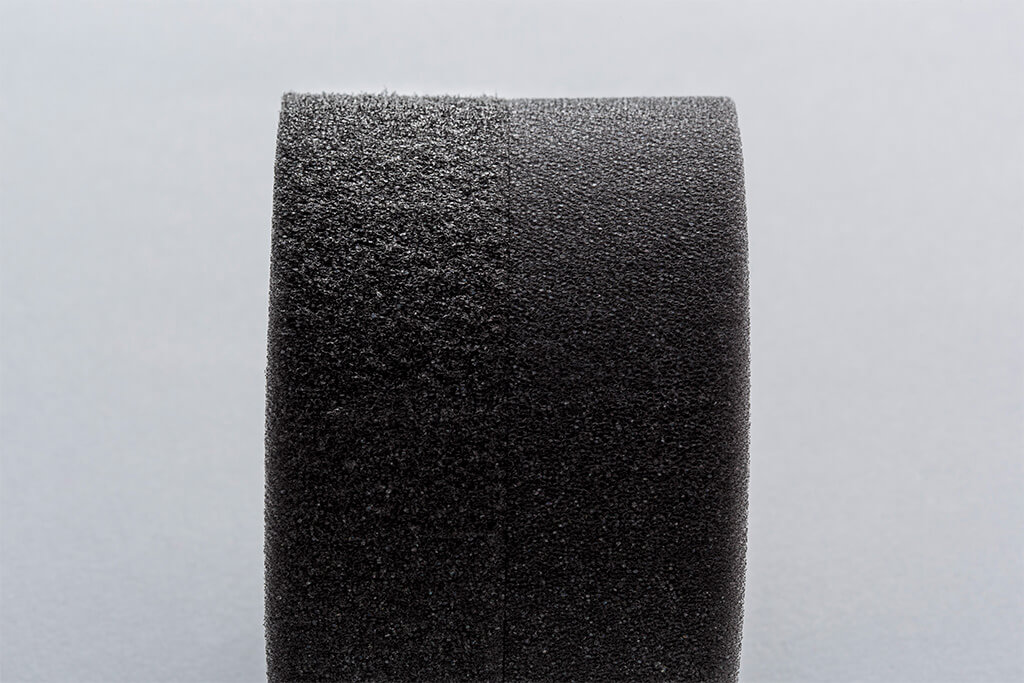
Although, in theory, the surface is flush with the tube wall, measurement results show the cutting method’s effect on the calculated absorption coefficient.
Manufacturers for impedance tubes sometimes supply a drilling tool, similar to a socket cutter, for clamping in a pillar drill which can be used to cut the material specimen to size from the sheet material. In the case of soft foam materials, this can lead to the material being dimensionally accurate in the upper region of the specimen but becoming convex in the lower region, that is to say having a larger diameter. This is due to the specimen being compressed while it is being cut. Cutters with a low wall thickness displace less material with the result that higher dimensional accuracy can be can be ensured here.
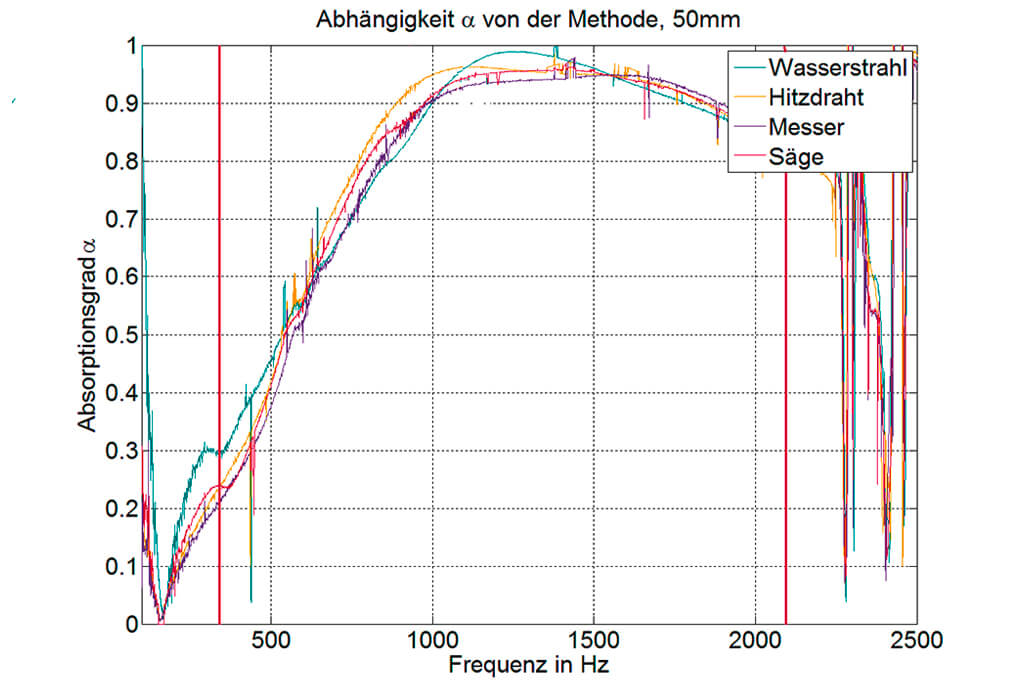
Although no details are given in DIN 10534-2 regarding the method of cutting the test specimen and the accuracy of the test specimen, there are clear differences in the absorption coefficient determined, which are due to the cut. Fig. 3 shows how the four different cutting methods: water jet, hot wire, saw and rotary cutter can lead to different measured absorption coefficients. The plot is created here for material thickness 50 mm and a diameter of 90 mm. It can clearly be seen that discrepancies exist between the various curves of the absorption coefficients over the entire frequency range. They are particularly noticeable in the range between 400 Hz and 500 Hz and also between 1000 Hz und 1500 Hz. The cut-on frequencies of the pipe are marked in the diagram with red vertical lines. They are at 354 Hz and 2191 Hz.
The serial examination shown here in extracts is based on a large number of preliminary studies. In addition to fundamental investigations on the influence of the temperature in the room and the tube, the influence of the signal shape and amplitude, the position of the microphones, the cut-on frequencies of the tube, etc., it was investigated how accurately a measurement can be repeated. If the specimen is left installed in the tube, the absorption coefficient can be reproduced well when measured again.
The evaluation is performed in different ways: on the one hand the scatter between the various measurements or test specimens is determined and represented graphically as a scatter band. On the other hand, various single values are calculated which are used as target variables in the calculation of sensitivity analyses (variance analyses). The α_w value is known from the literature and the classic indicators of a curve analysis are also used: mean value, variance, skewness and kurtosis. The variance analysis shows whether parameters do or do not have an influence. However, this means that information about the course of the absorption coefficient is lost, which is why it is not yet possible to replace the visual comparison of different measurement results completely.
Designing standards to suit the application
The sensitivity analysis method is used here for the first time to determine and quantify the uncertainties when measuring the absorption coefficient in the impedance tube. By means of research in this area, it would be possible to formulate individual aspects of DIN ISO 10354-2 more precisely, thus leading to much higher comparability of different measurements.

Contact
- Antje Grebel
- Phone: +49 6151 16-23510
- grebel@sam.tu-darmstadt.de